Area and Line Chart
Visualize trends and patterns over time or continuous data
Use me when you want to watch your data flow like a river over time or across continuous data. Line charts show the path of change (are we going up or down?), while area charts add visual weight to show volume and magnitude. Perfect for stock prices, website traffic, sales trends, or anything that moves through time.
I turn your temporal data into a story with a clear plot. Comparing the growth (or decline) to standard curves like logarithmic, square, or linear growth can be helpful - add a separate function or trendline to see how your data measures up. Some curves benefit from upper and lower boundaries that show confidence intervals for predictions or thresholds indicating when values are in range or exceed limits. You can compare flows across different categories using subplots, or simply change the marker style per category and view everything together.
Video Tutorial
Overview
Area and line charts display data as continuous lines connecting data points, with area charts filling the space below the line. They excel at showing trends, patterns, and changes over time or across a continuous range. Line charts emphasize the path and direction of change, while area charts add visual weight to emphasize magnitude and cumulative values.
Best used for:
- Tracking trends over time (you can also use our dedicated Time Series plot for this)
- Comparing multiple data series
- Showing continuous data progression
- Highlighting changes and patterns
- Visualizing cumulative totals (area charts)
- Emphasizing magnitude differences (area charts)
- Showing confidence intervals for values
- Comparing changes to standard growth curves like square, logarithmic, or linear
Common Use Cases
Time Series Analysis
- Stock prices and market trends
- Website traffic over time
- Sales performance tracking
- Temperature and weather patterns
- Resource usage monitoring
- Growth metrics and KPIs
Performance Tracking
- Revenue and profit trends
- Customer acquisition over time
- Project progress and milestones
- System performance metrics
- Error rates and uptime
- User engagement metrics
Comparative Analysis
- Multiple product lines
- Regional performance comparison
- Actual vs. predicted values
- Before/after scenarios
- Competing metrics side-by-side
- Treatment vs. control groups
Line Chart vs. Area Chart
Line Chart
When to use:
- Emphasizing trend direction and rate of change
- Comparing multiple overlapping series
- When exact values matter more than magnitude
- Showing volatile or noisy data
- 5+ series need to be compared
Characteristics:
- Clean, minimal visual weight
- Easy to distinguish multiple lines
- Focus on the path of change
- Less cluttered with many series
Area Chart
When to use:
- Emphasizing magnitude and volume
- Showing cumulative totals
- Highlighting the "weight" of data
- Single series or stacked comparisons
- Part-to-whole relationships (stacked)
Characteristics:
- Adds visual weight and emphasis
- Better for showing volume
- Can be stacked to show totals
- More dramatic visual impact
Chart Variations
Single Series
Simple line or area showing one variable over time.
Multiple Series
Comparing 2-5 different variables or groups.
Stacked Area
Areas stacked on top of each other to show cumulative total and individual contributions.
Overlapping Lines
Multiple lines on same axes for direct comparison.
Orientation
Decide if horizontal or vertical.
Design Best Practices
Most of the design best practices are pre sets that you do not have to change.
1. Choose the Right Type
- Line chart: For emphasis on trends and multiple comparisons
- Area chart: For emphasis on magnitude and volume
- Stacked area: For part-to-whole relationships over time
2. Limit Number of Series
- 1-3 series: Optimal, easy to distinguish
- 4-5 series: Acceptable with good colors
- 6+ series: Consider splitting into multiple charts or using small multiples
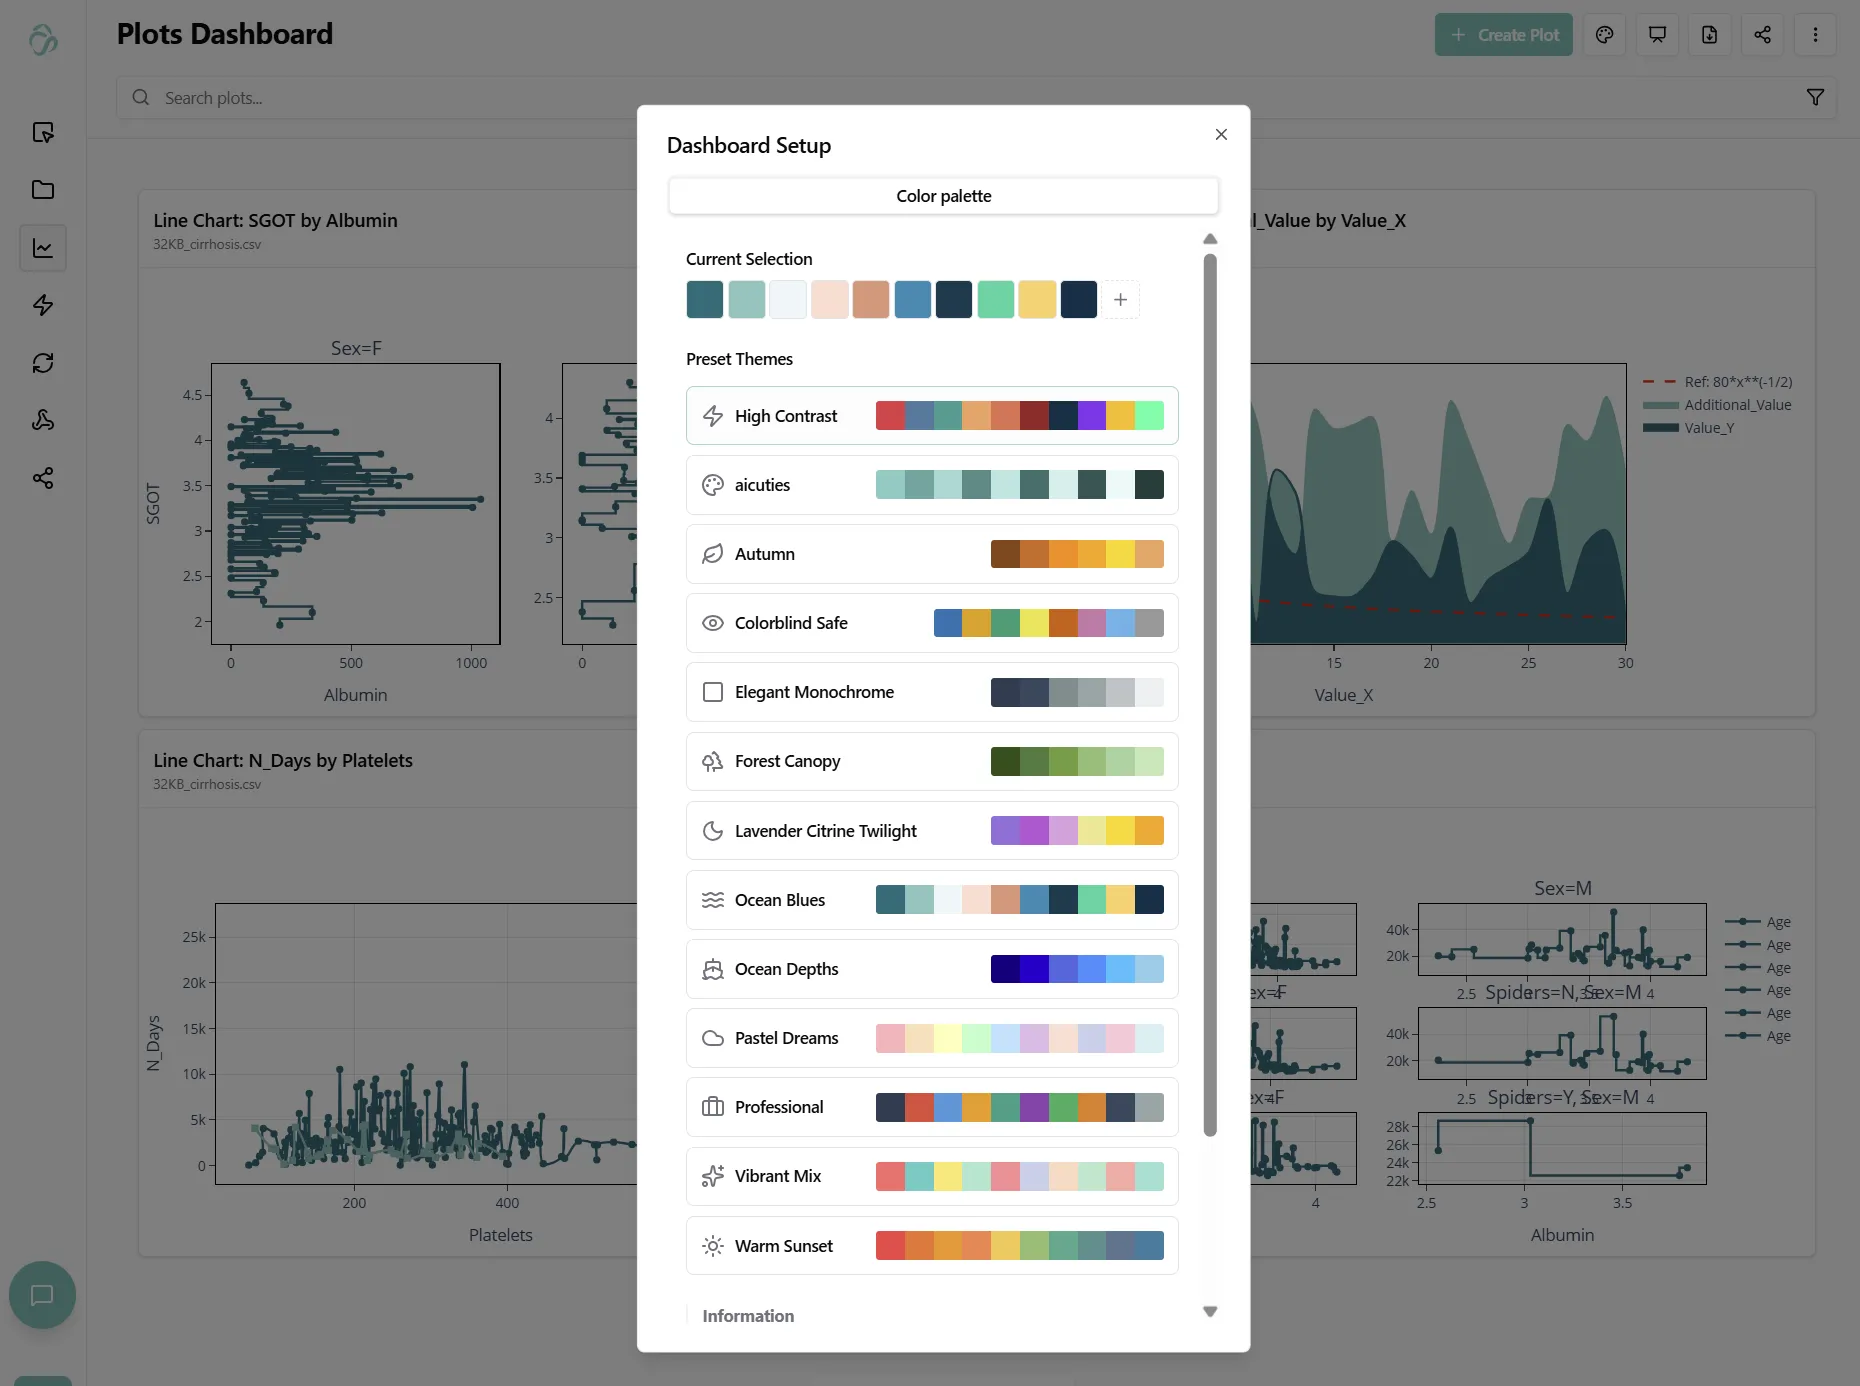
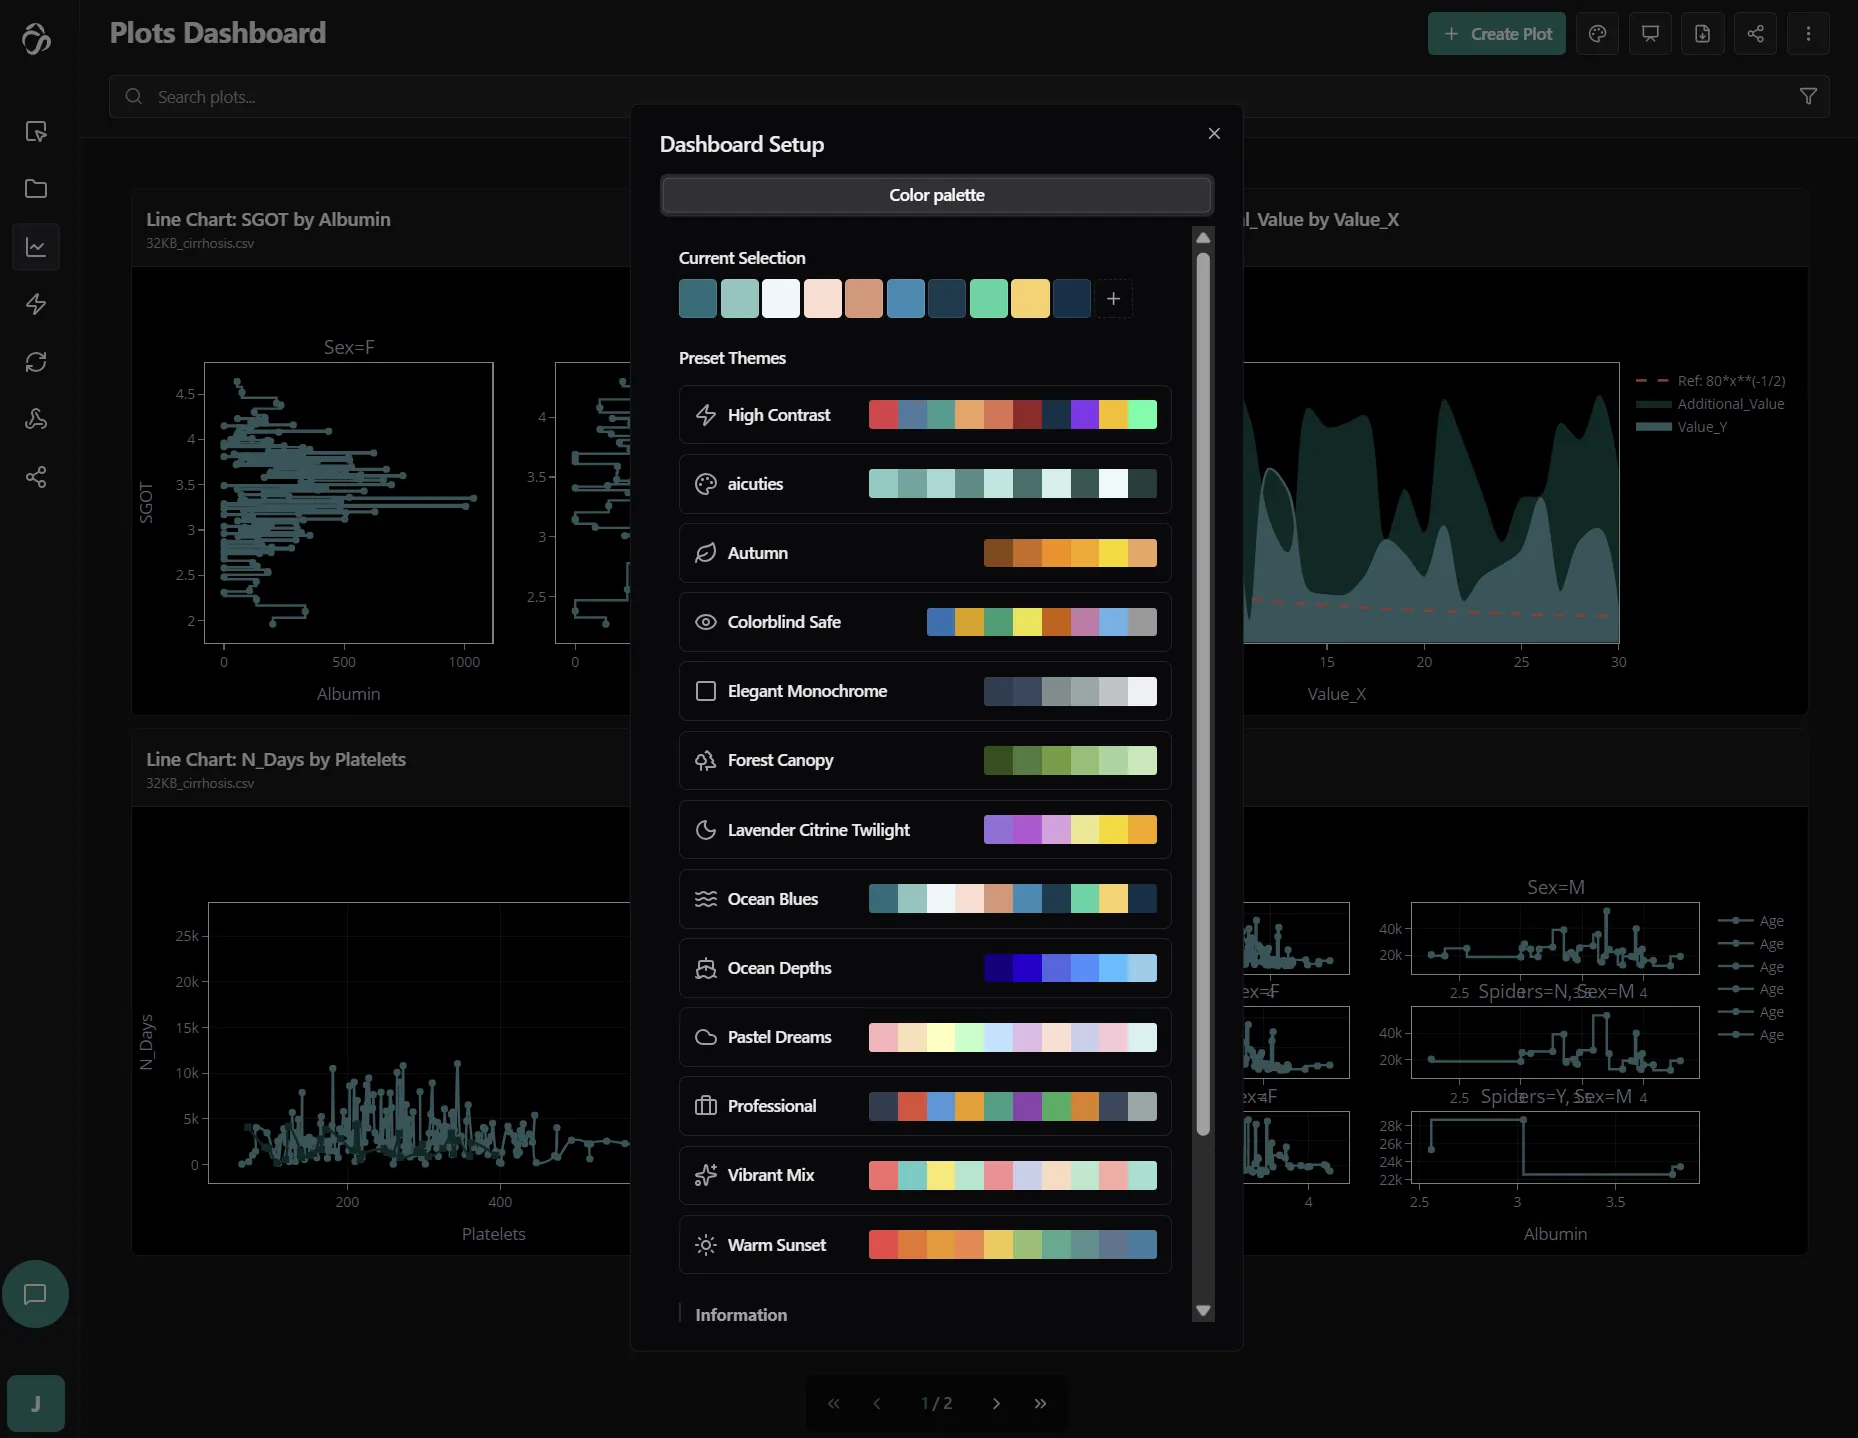
3. Color Strategy
- Use distinct, accessible colors for each series
- Ensure sufficient contrast with background
- Consider colorblind-friendly palettes that are preconfigured for you
- Use lighter fills for area charts to maintain readability
- Keep line thickness readable (2-3px typically)
4. Axis Configuration
- Start y-axis at zero for area charts (shows true magnitude)
- Consider starting above zero for line charts if appropriate (emphasizes changes)
- Use consistent intervals
- Label axes clearly
- Include units in axis titles
5. Legend and Labels
- Place legend where it doesn't obscure data
- Use direct labeling when possible (label lines directly)
- Keep legend order consistent with visual order
- Include units and context in labels
Tips for Effective Visualization
Time Series Specific
-
Choose appropriate time intervals:
- Match interval to data granularity
- Avoid too many or too few data points
- Consider aggregation for long time ranges
-
Handle gaps and missing data:
- Decide on interpolation strategy
- Make gaps visible if meaningful
- Document data quality issues
-
Add context markers:
- Annotate significant events
- Mark policy changes or launches
- Highlight anomalies or outliers
- Show seasonal patterns
Comparison Guidelines
- Use consistent scales across compared series
- Align time periods for fair comparison
- Consider normalization (percentages, indices) for different scales
- Add reference lines (averages, targets, benchmarks)
Common Patterns and Interpretations
Trends
- Upward trend: Increasing values over time
- Downward trend: Decreasing values over time
- Flat trend: Stable, consistent values
- Cyclical pattern: Regular up-and-down cycles
- Seasonal pattern: Recurring patterns at specific intervals
Changes
- Sharp spike: Sudden increase (event, anomaly)
- Sharp drop: Sudden decrease (problem, intervention)
- Gradual change: Slow increase or decrease
- Step change: Sudden level shift that persists
- Volatility: High variation and noise
Relationships
- Convergence: Lines moving toward each other
- Divergence: Lines moving apart
- Correlation: Lines moving together
- Leading/lagging: One series predicts another
When to Use Alternative Visualizations
Instead of line/area chart, consider:
- Bar chart: For discrete categories or small number of time periods
- Scatter plot: When emphasizing individual data points or correlations
- Heatmap: For many time series or dense temporal data
- Box plot: To show distribution changes over time
- Waterfall chart: For cumulative effects and contributions
Complement with:
- Summary statistics: Mean, median, trends
- Control charts: Statistical process control
- Forecast lines: Predicted future values
- Confidence intervals: Uncertainty bands
Example Scenarios
Stock Market Performance
Comparing multiple stock prices over time with line chart. Shows relative performance and volatility.
Website Traffic Analysis
Area chart showing visitor volume over months. Stacked areas show traffic sources (organic, paid, referral).
Sales Forecast
Line chart with actual sales (solid line) and predicted sales (dashed line). Shows accuracy of predictions.
Temperature Trends
Line chart showing daily average temperatures across seasons. Includes record high/low reference bands.
Revenue Breakdown
Stacked area chart showing revenue by product category. Total height shows overall revenue, colors show contributions.
Regression
Line chart showing actual data points with regression line and confidence interval bands. The shaded area represents prediction uncertainty, helping visualize model fit quality and identify outliers.
Troubleshooting
Issue: Lines overlap and are hard to distinguish
- Solution: Use distinct colors, increase line width (2-3px), reduce number of series, or consider small multiples (separate charts per series).
Issue: Stacked areas show misleading totals
- Solution: Verify data is appropriate for stacking (all positive values), check aggregation method, ensure time alignment is correct.
Issue: Area fills obscure data behind them
- Solution: Reduce opacity (try 30-50%), use line chart instead, or reorder series (put smallest on top, largest on bottom).
Issue: Too many data points create jagged lines
- Solution: Smooth lines using spline interpolation, aggregate data to fewer points (e.g., daily to monthly), or apply moving average.
Issue: Gaps in the line where data is missing
- Solution: Enable "Connect Gaps" to bridge missing values, or explicitly show gaps to indicate missing data. Choose based on context.
Issue: Can't see trend due to high variability
- Solution: Add trend line or moving average, smooth data before plotting, or use dual axis with raw + smoothed data.
Issue: Seasonal patterns dominate the view
- Solution: Detrend or deseasonalize data first, add reference lines for seasonality, or use time series decomposition plots.
Issue: Legend blocks important data
- Solution: Reposition legend (outside plot area), use direct line labeling instead, or make legend semi-transparent.
Issue: Need to show confidence intervals
- Solution: Use area chart with fill between upper and lower bounds, reduce opacity to show uncertainty range.
Related Visualizations
After creating a line or area chart, consider:
- Bar chart - Compare totals across periods
- Scatter plot - Analyze correlations between variables
- Box plot - Show distribution statistics over time
- Heatmap - Visualize patterns in dense time series
- Time Series - Separate trend, seasonality, and noise with dedicated time series tools