AI Predictions with Arduino
Learn how to integrate Arduino/ESP32 with Aicuflow to train AI models based on real world sensor data. This is a basic example you can follow. The use case be expanded to collect sensor data from large amounts of devices with peripheral sensor / actor devices like SPS.
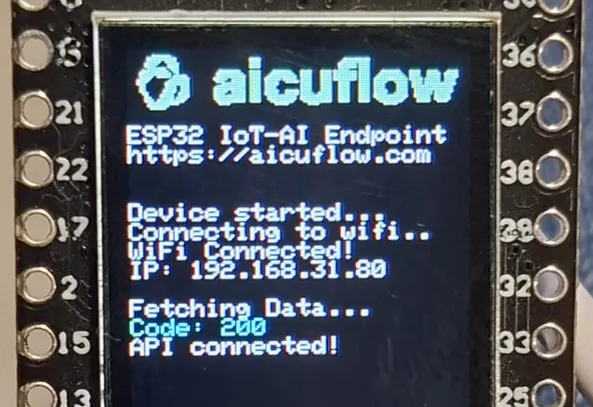
This tutorial focuses on the ESP-32 TTGO-T1 with Arduino IDE, because it can be connected to the Internet easily and has a display - great for debugging purposes.
Platform Setup
- Make sure you have an aicuflow account (register now).
- Set up your IDE and Microcontroller Library (see library details)
- Create a new flow (can be empty)
- Connect your Microcontroller to your computer / laptop
Then clone the Aicuflow-Arduino Repository and set up the settings (Wifi, Login, Sensors):
git clone https://github.com/AICU-HEALTH/aicuflow-arduinoReceiving data
You can use our data ingress endpoint (public API, requires Auth) to transmit data to a specific flow:
{{base_url}}/data/write-values/?filename=sensor_data.arrow&flow={{flow_id}}Please only post a list of sensor read values to the endpoint, it may look like this:
// missing values will be set to null automatically
[
  {
    "millis": 23943,
    "hall_sensor": 42,
    "voltage": 4.92,
    "temperature": 14.3,
    "other_value": "strings also allowed"
  },
  {
    "millis": 24945,
    "hall_sensor": 42,
    "voltage": 4.92,
    "temperature": 14.3,
    "other_value": "strings also allowed"
  }
]
We are going to publish an Arduino sketch for this.
Currently, it is only available upon request for a few days.
Our review will be done soon.
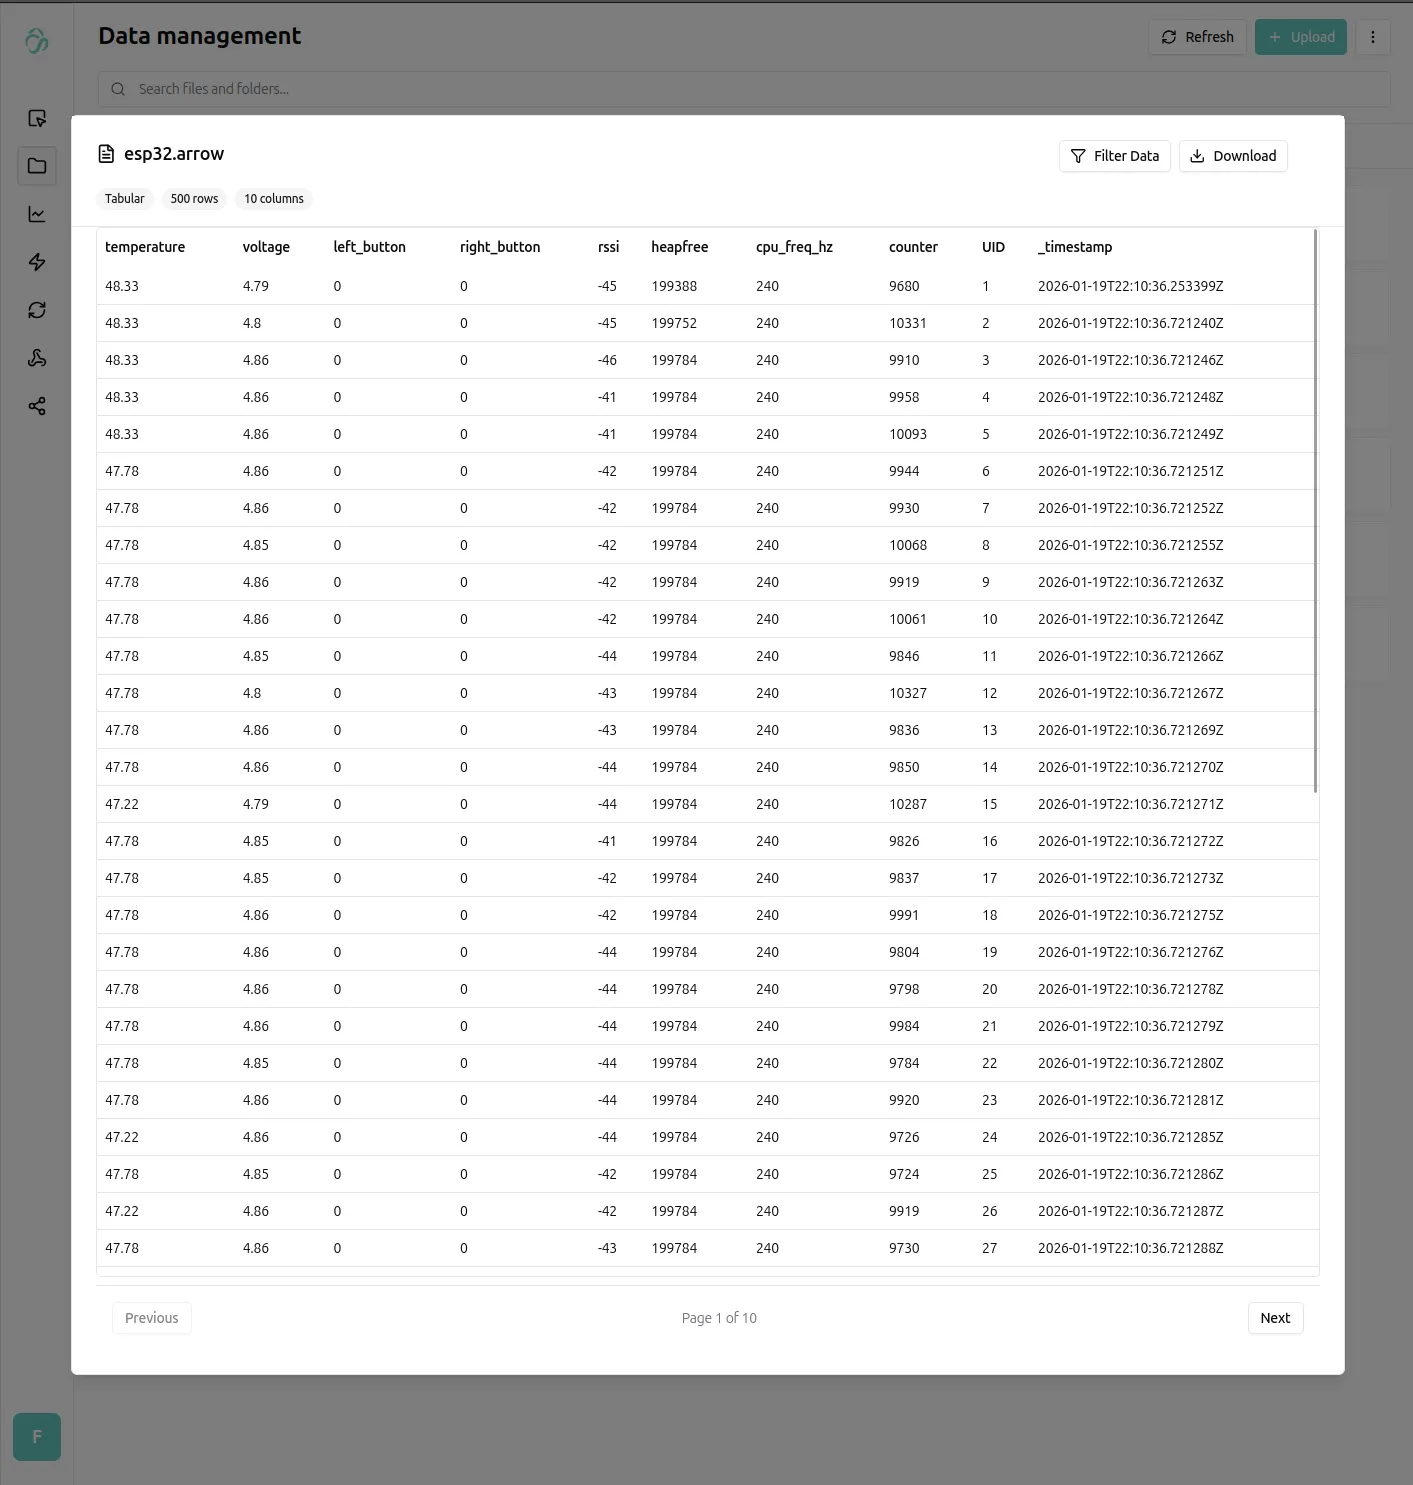
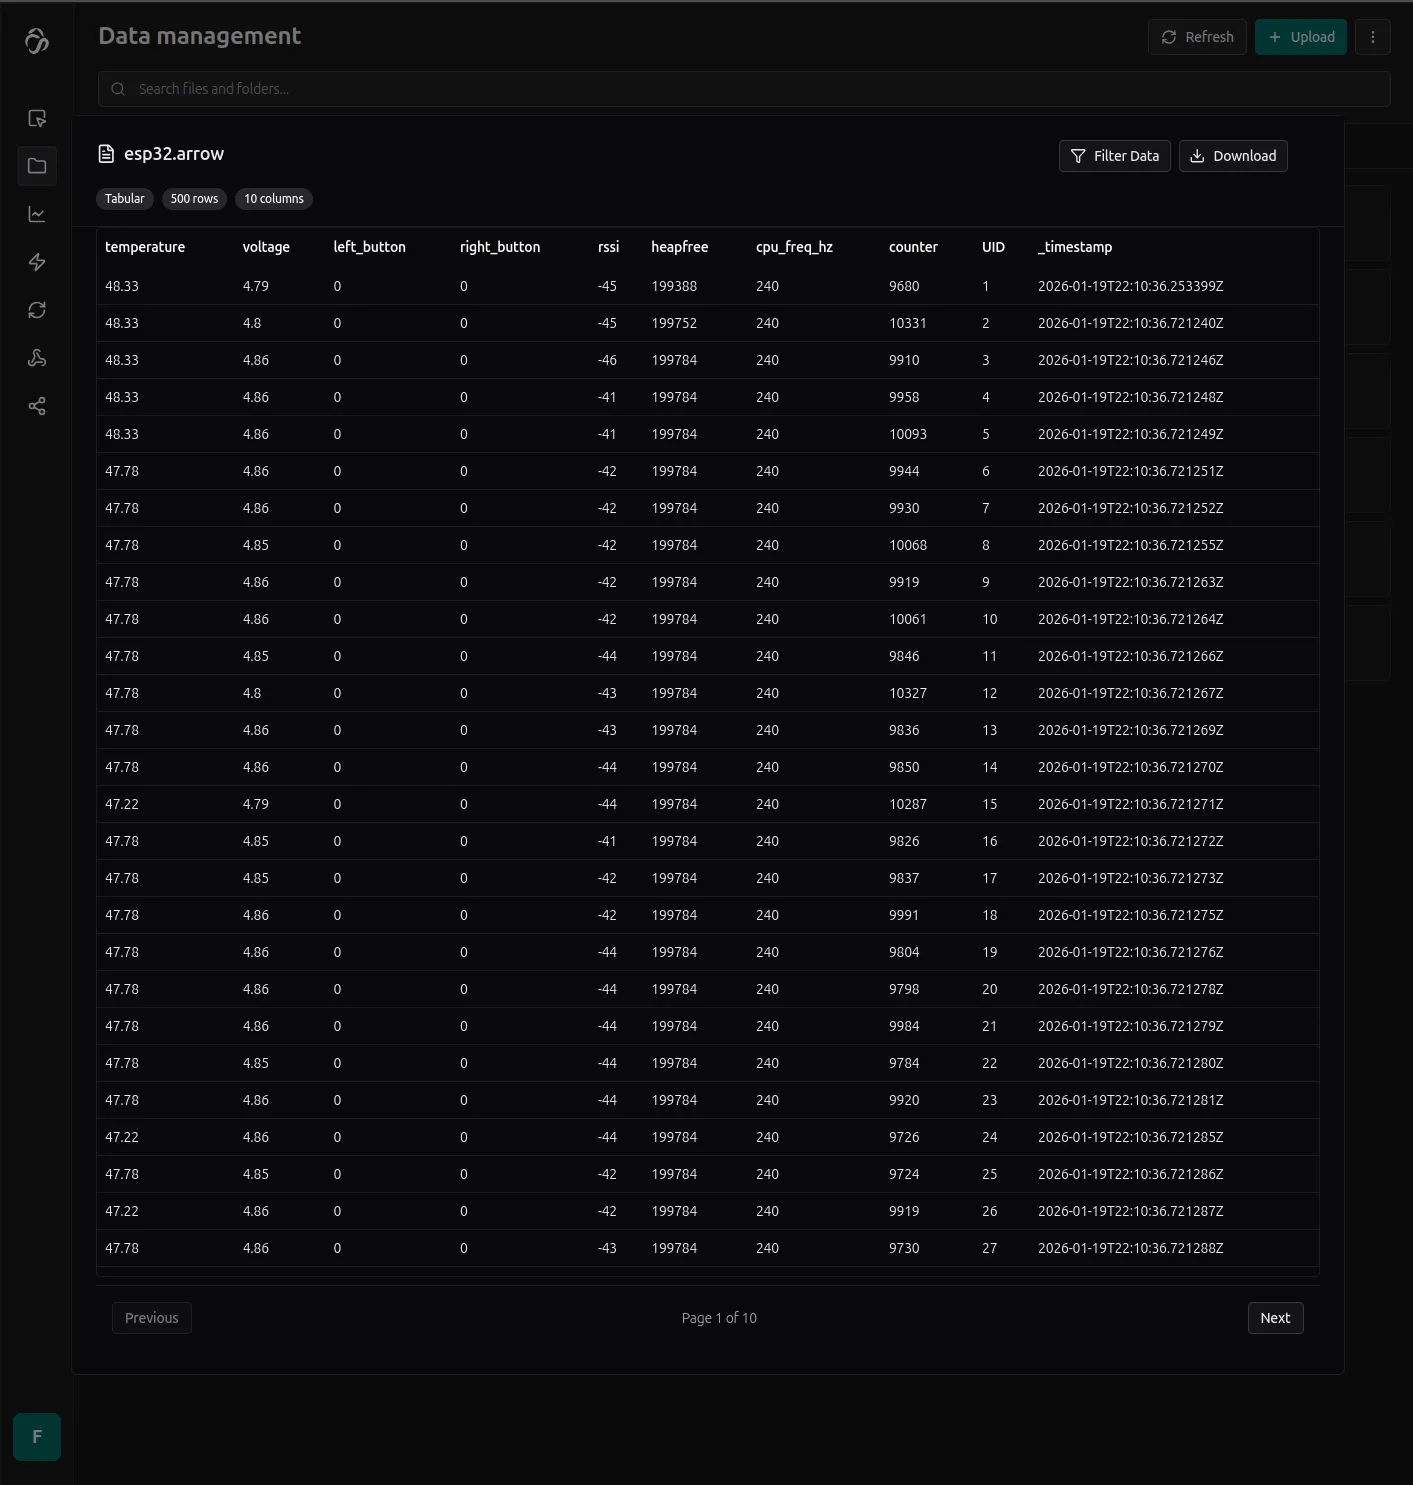
Preview the data in the file manager
Posting to the above endpoint correctly will result in a tabular file being created and appended within your respective flows file manager (also possible with the python client). The data can be previewed.
Analyzing Data
Now, we want to learn from this data. Our example is very simple, in the real world a measurement like this could be for many reasons.
Example real use cases (a few of which we encountered already):
- to detect issues in production facilities
- to monitor medical data at scale and corellate
- to track health data and corellate mental performance
- to analyze smart home appartment complexes for heat leakage
- ... and many more use cases are possible ...
Let's analyze the collected data from our Microcontroller!
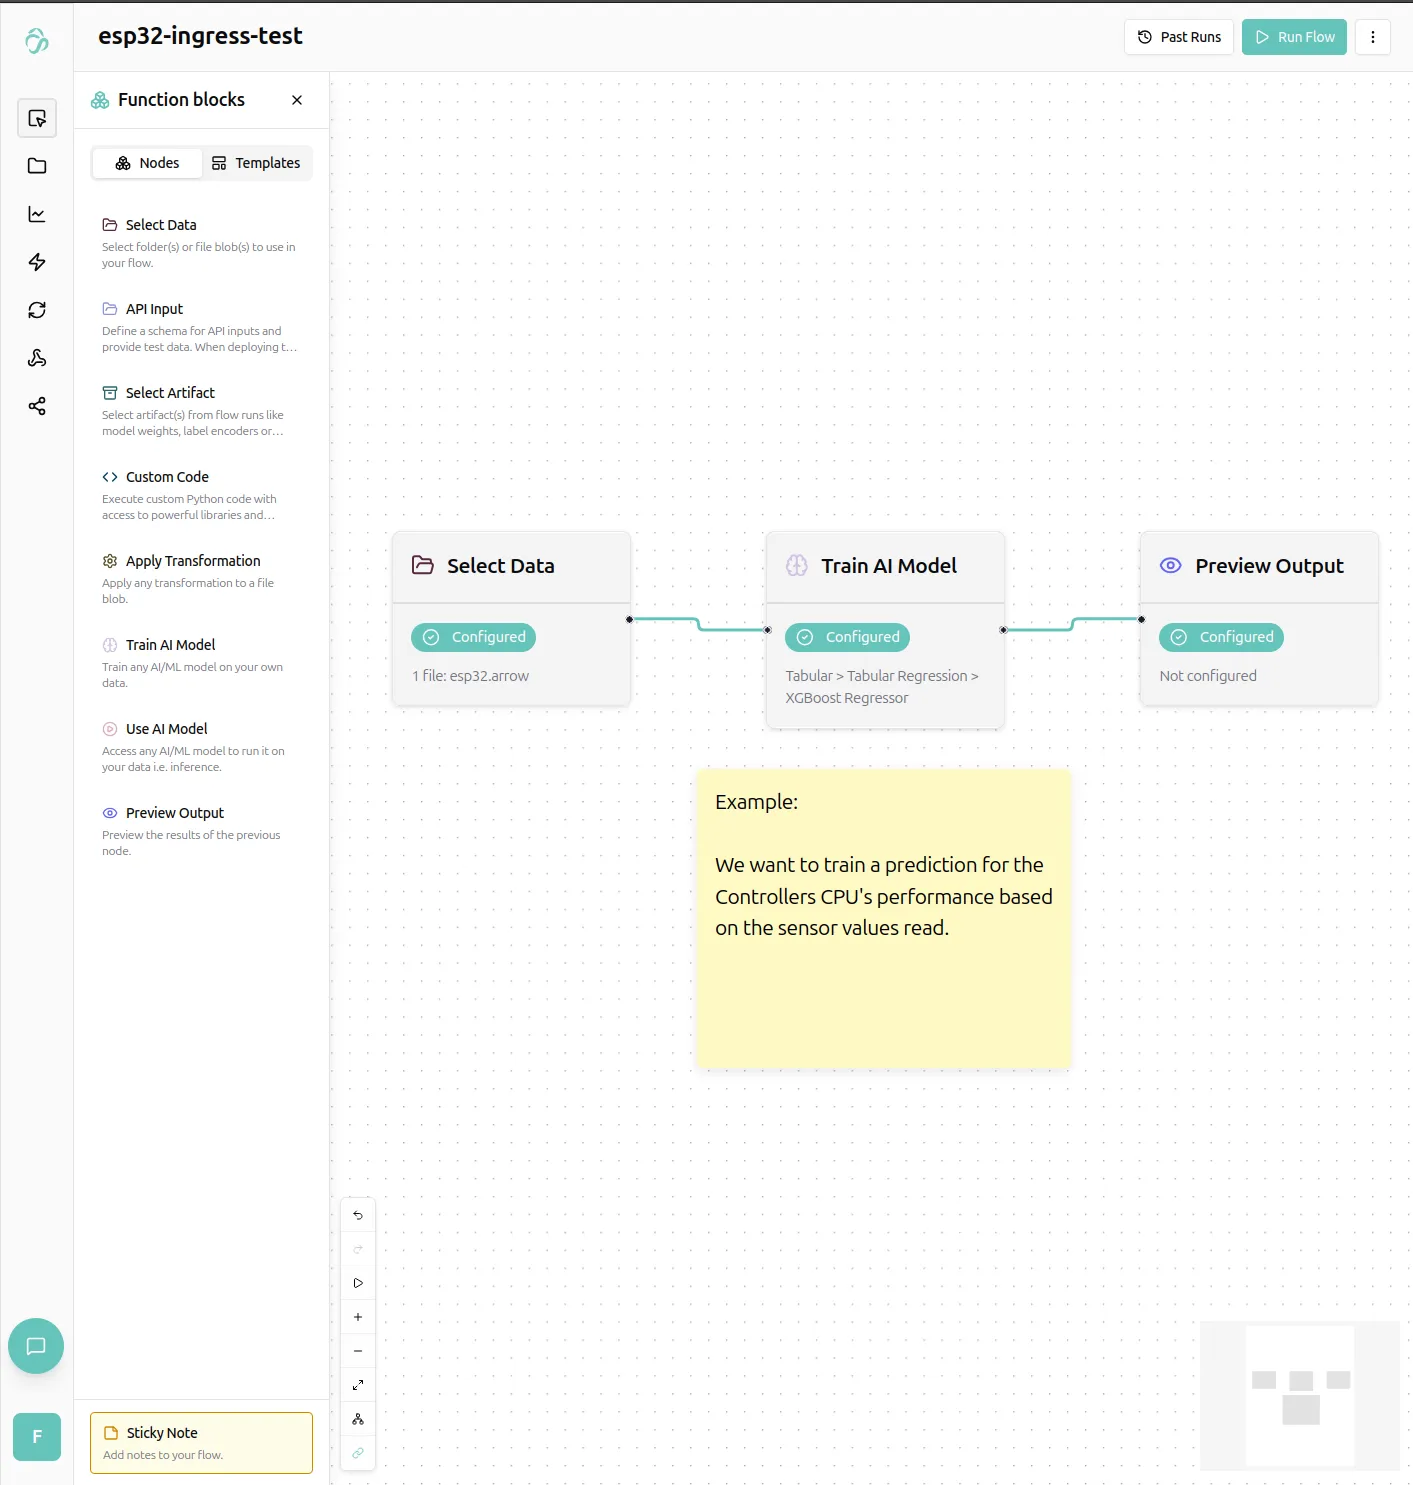
Training a performance predictor
We want to train a prediction to detect how the sensor values measurable on the chip (voltage, temperature, wifi strength, and more) relate to the chips performance (we count the amount of loop cycles in 10ms time).
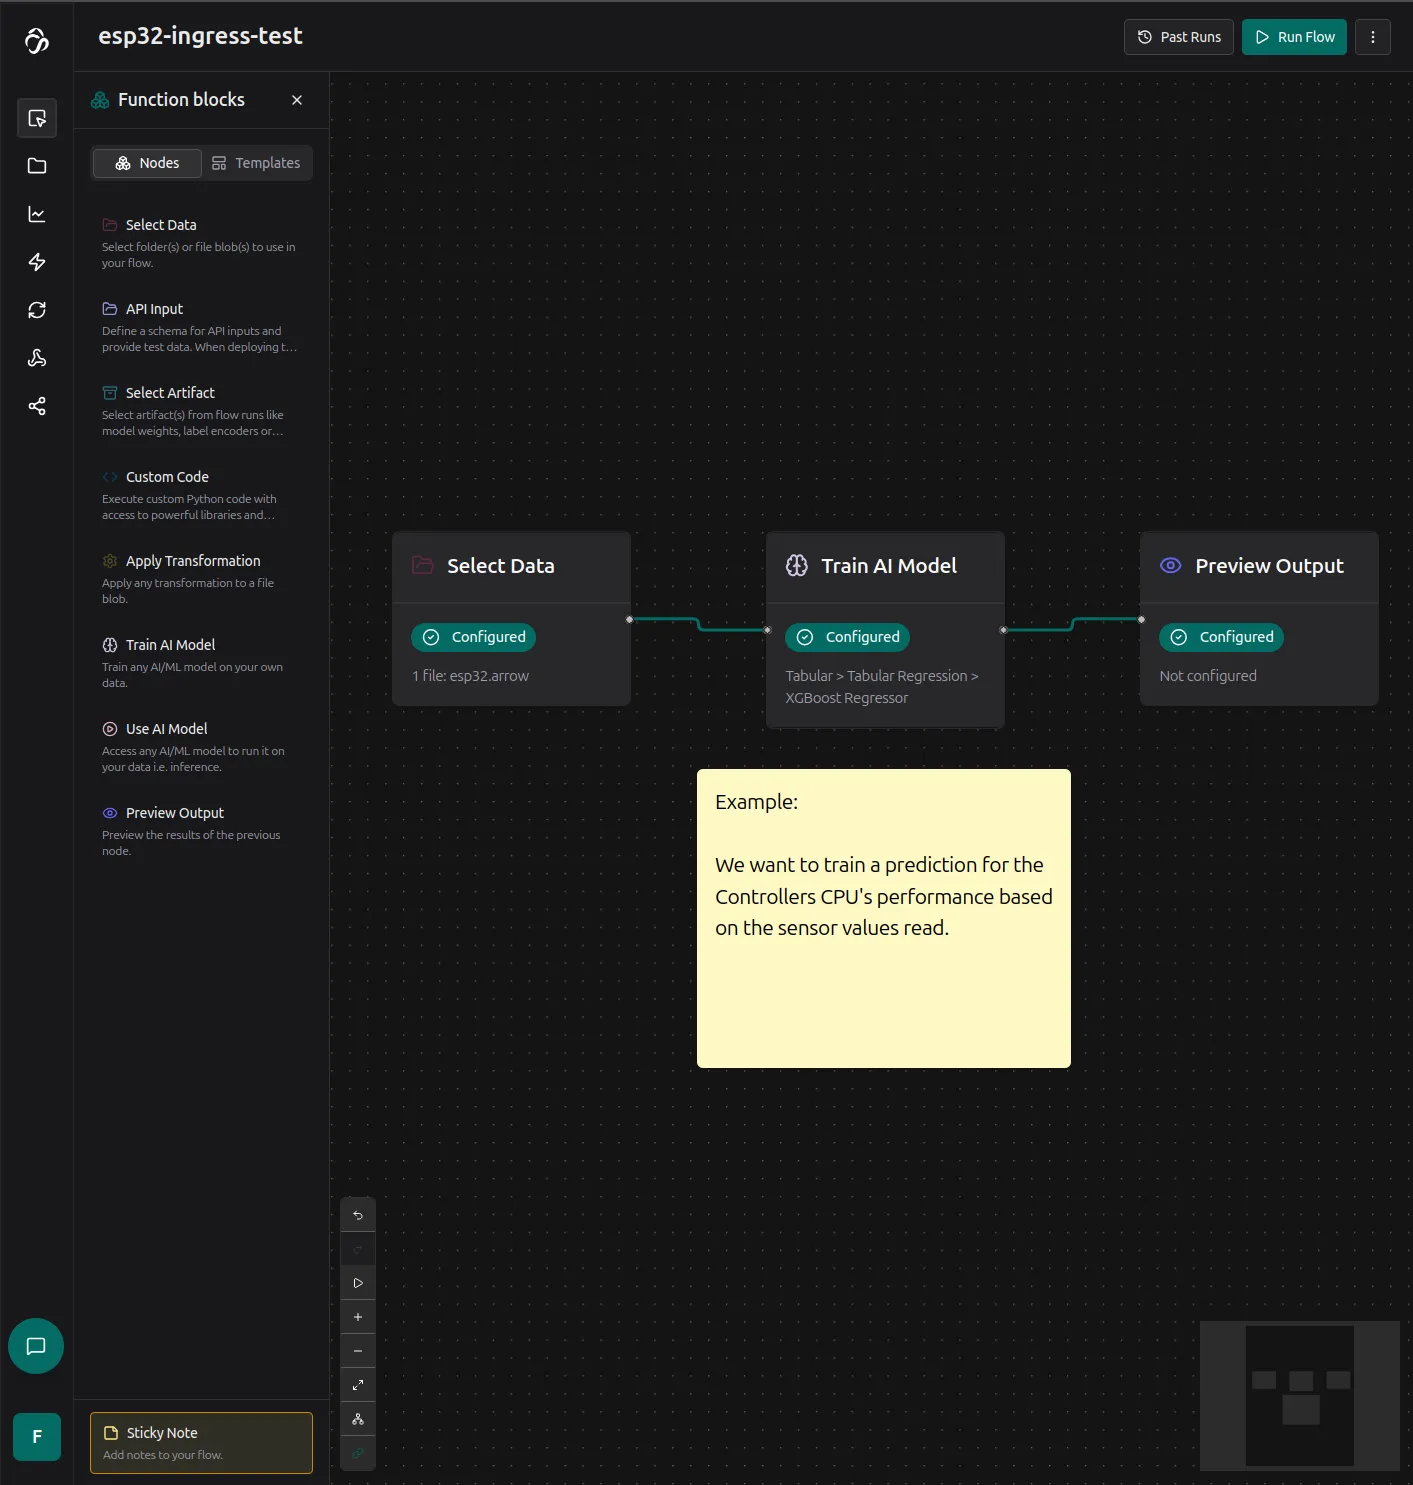
Clicking the preview output node, we get fit results from the model we trained. We could check the Hyperparameter tuning option on the train node properties to potentially get a more accurate model.
Plotting for correlations
We can create plots from the received data, for example a heatmap to see how the chips performance variies for different temperatures and chip voltages (measurable from ESP32-Arduino).
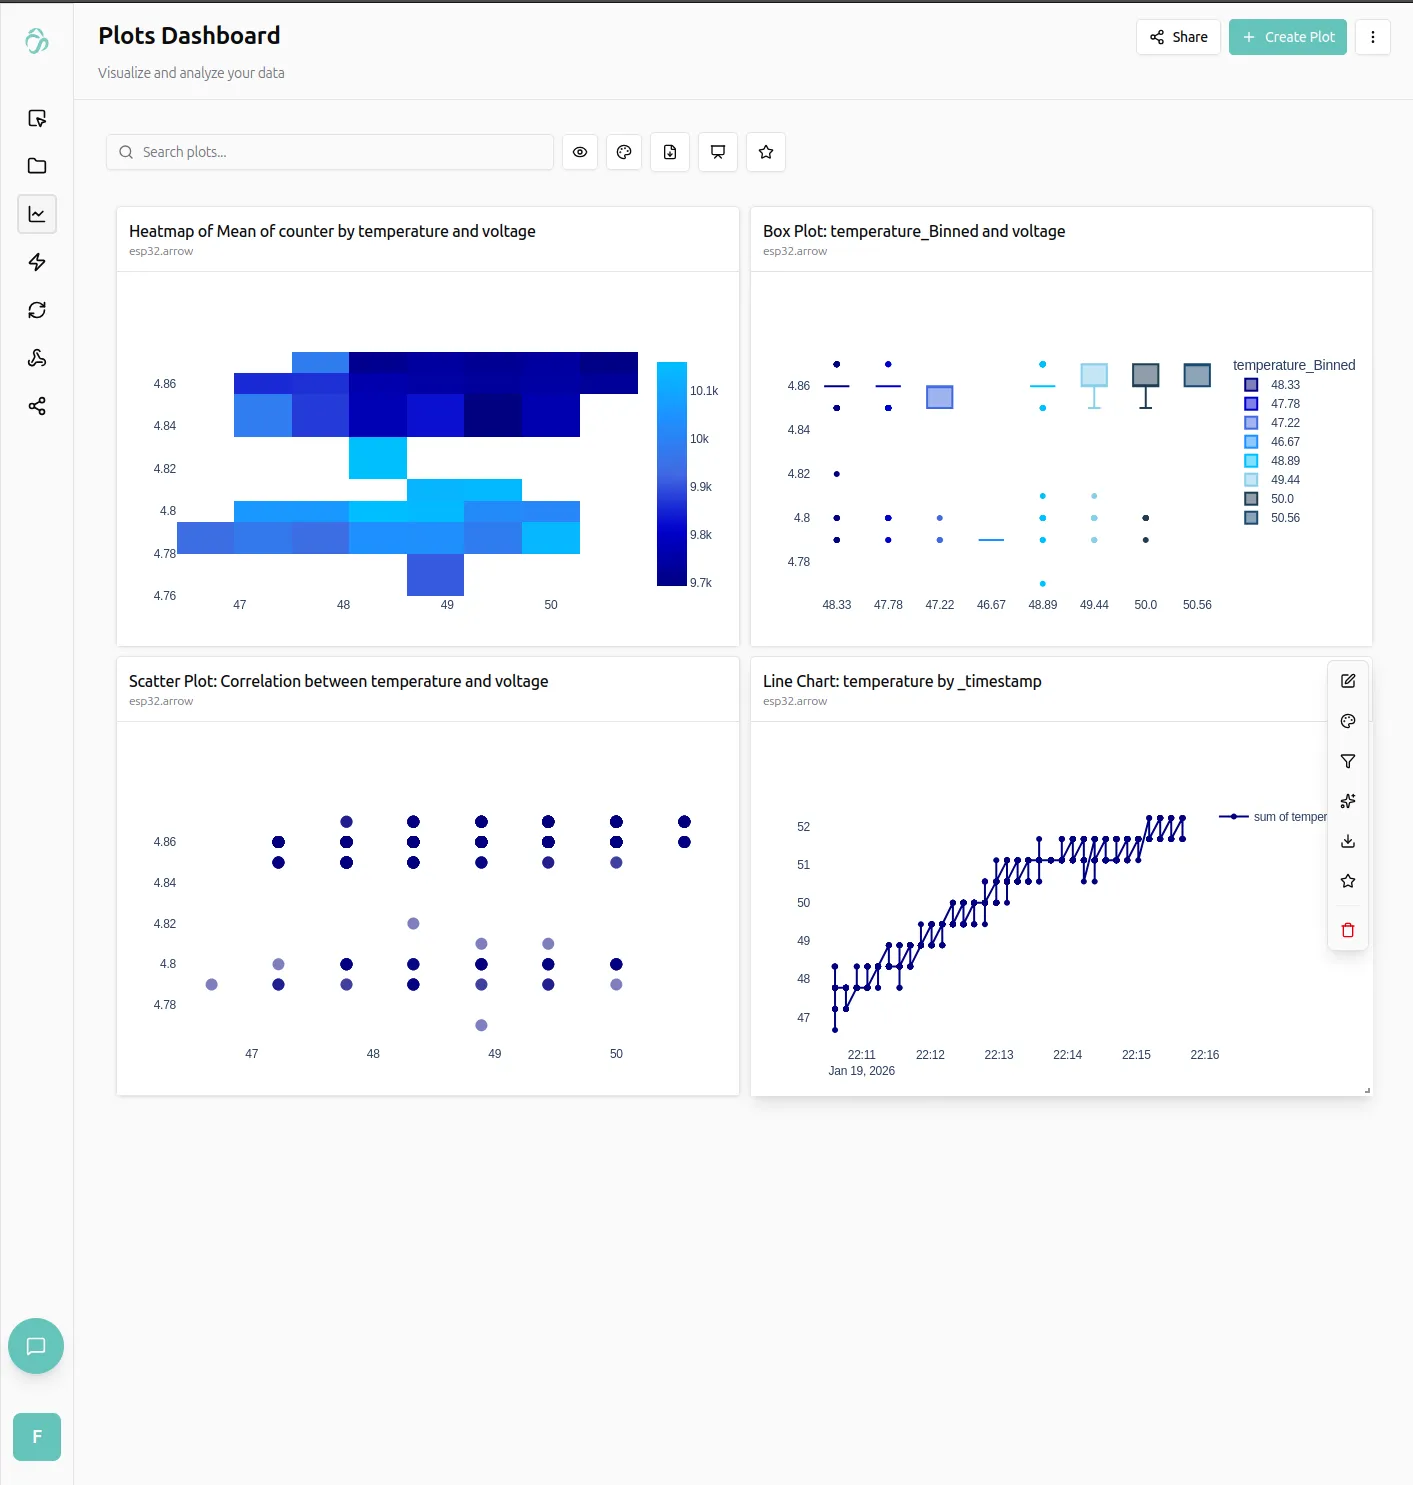
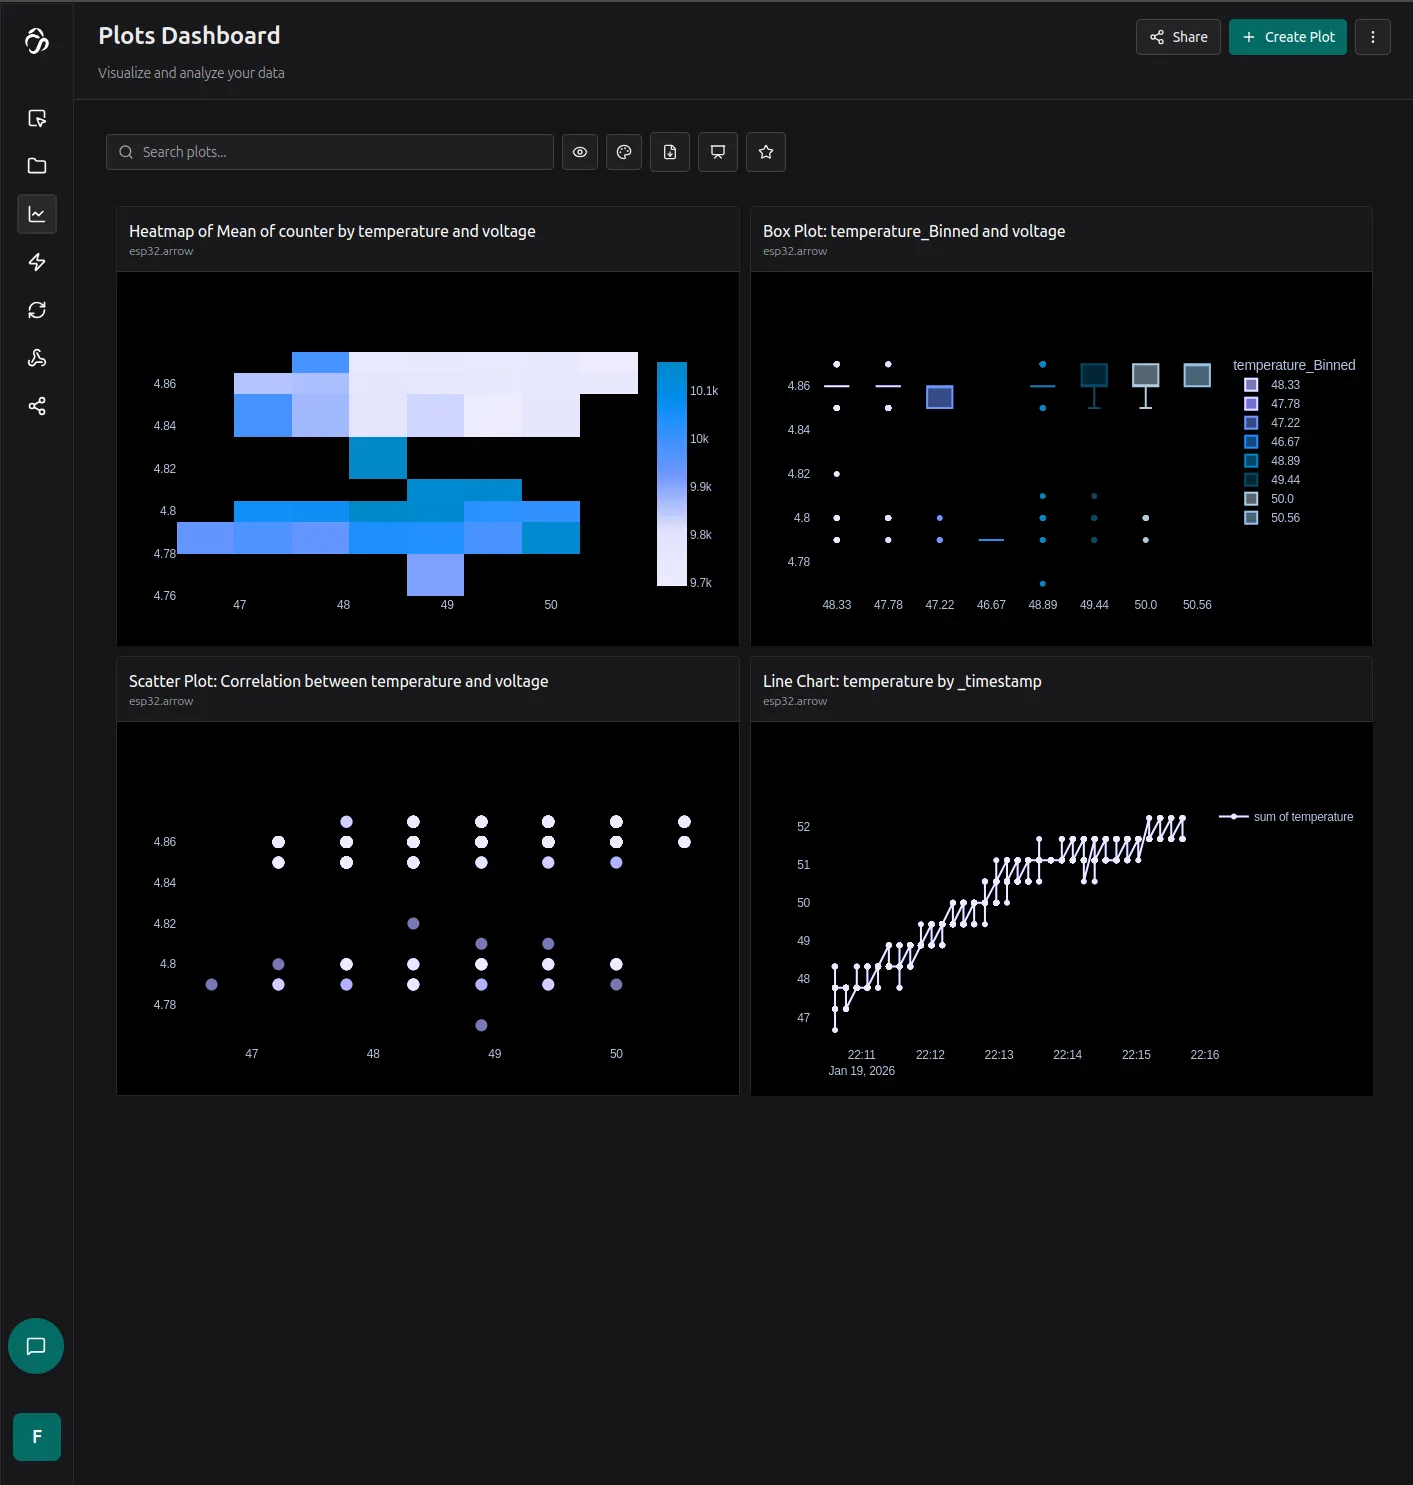
We can also click on the plots explain chart feature to get a summary:
- Lower voltage with medium temperature seems to be the best performance spot for this microcontroller.
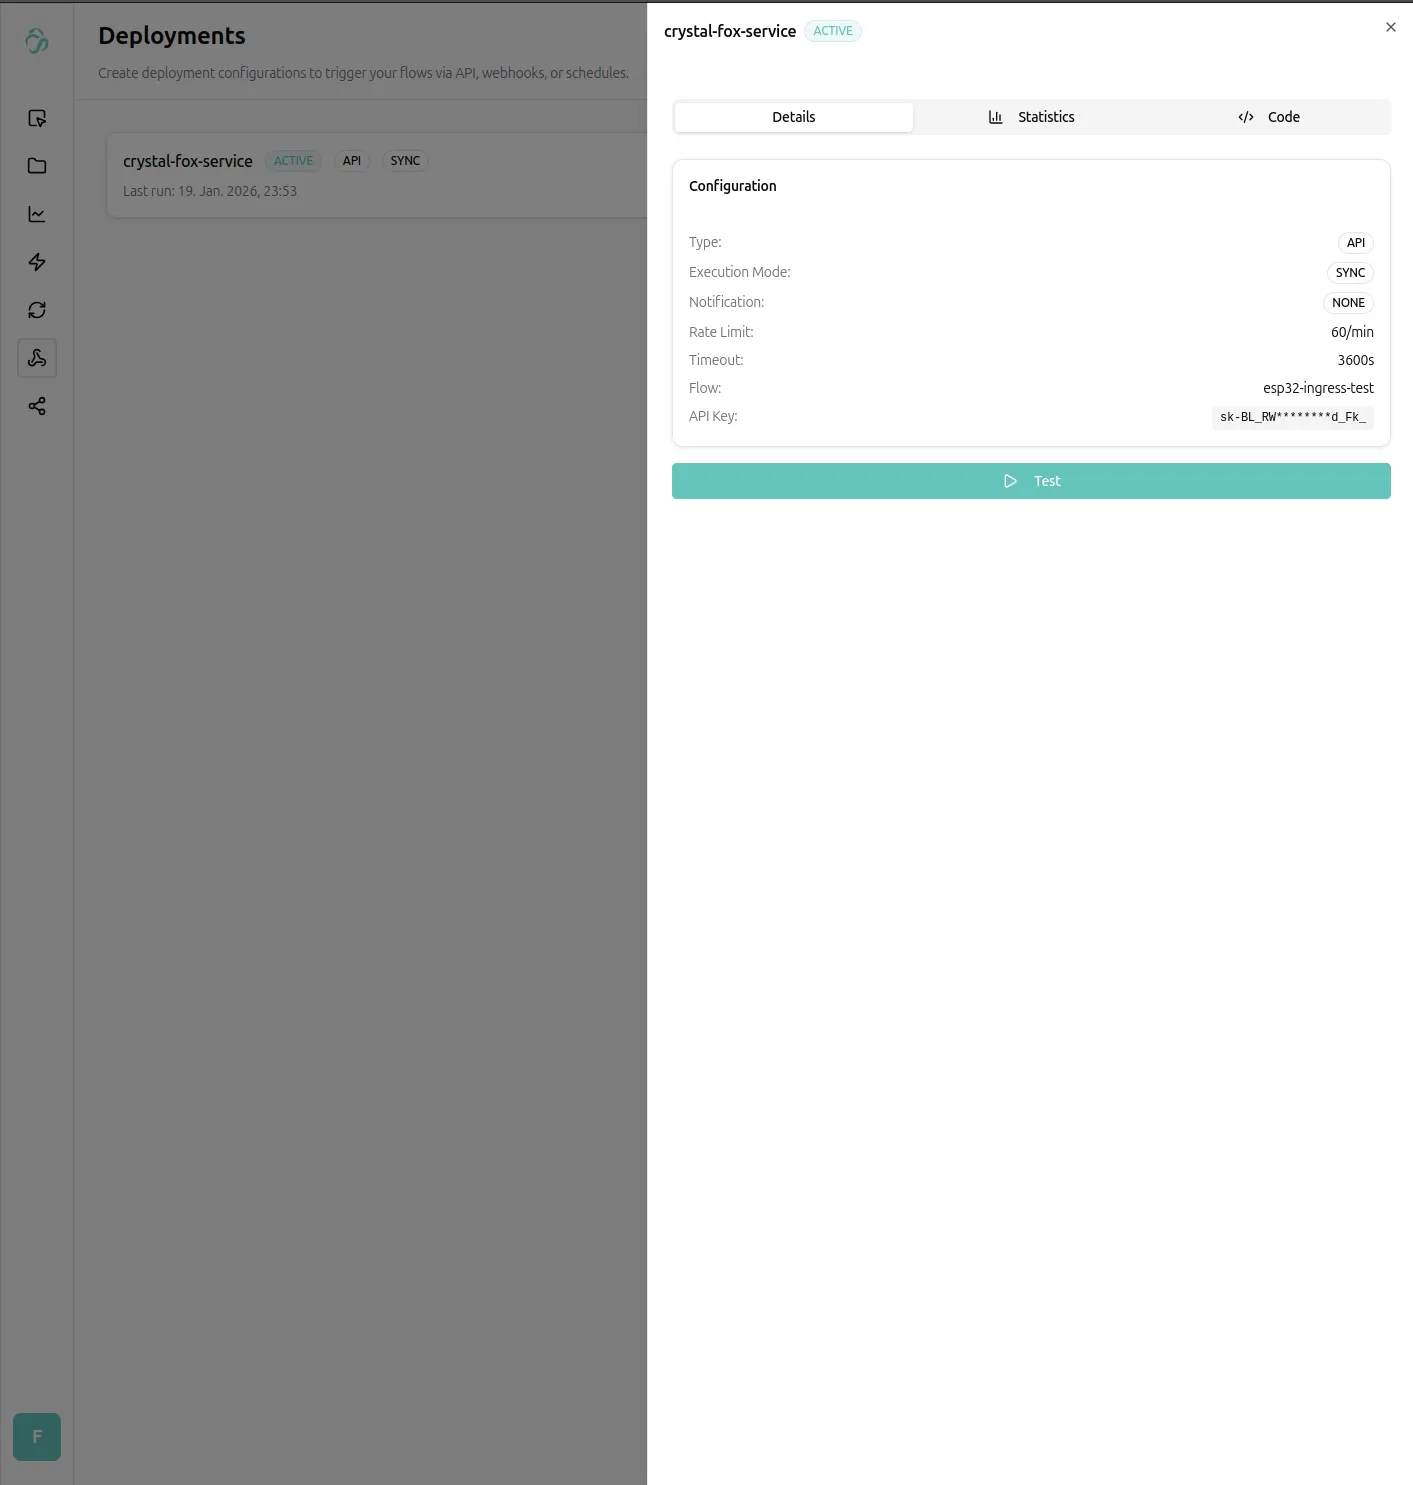
Deploying our model
We can deploy our trained model from the deploy tab.
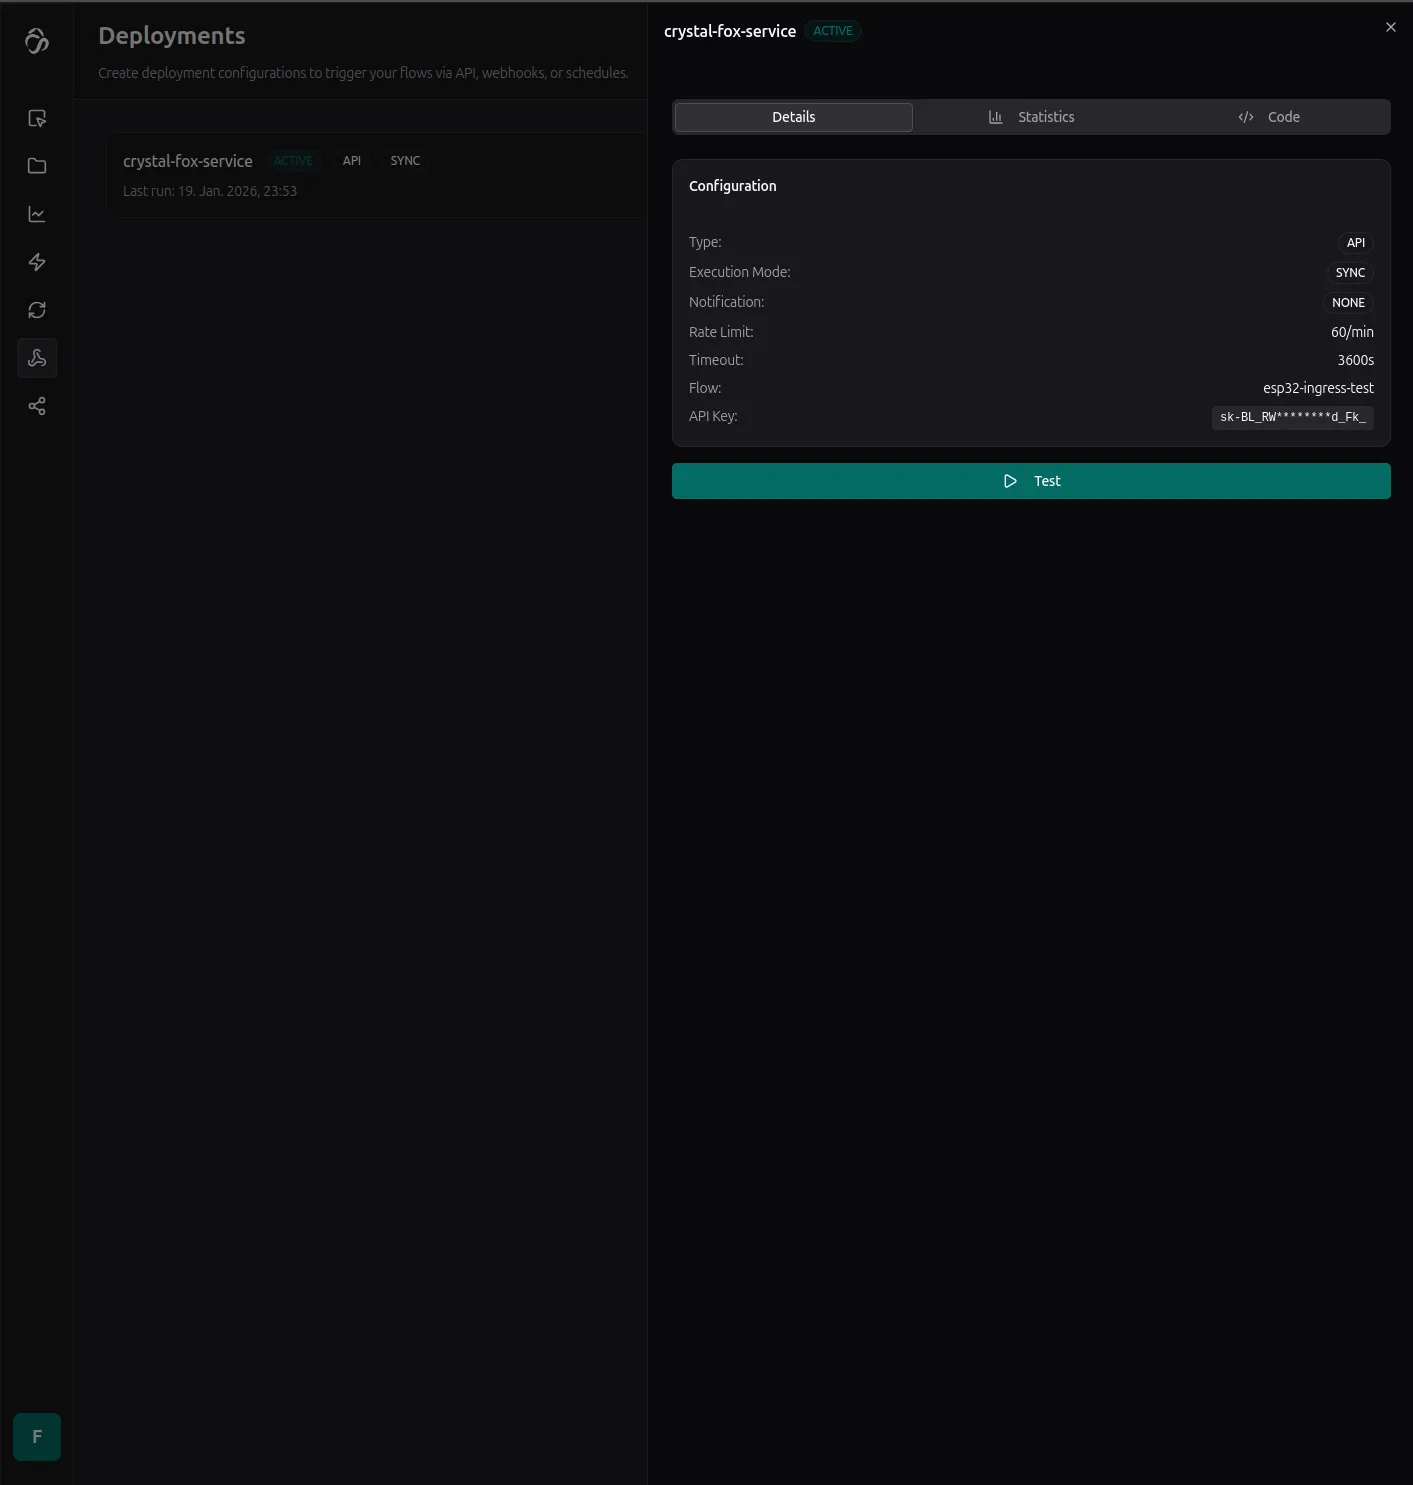
That's it, we will add more details soon, but you can reach out any time for custom usecases, integrations or code samples for you and your company (see enterprise customers).
Basic Sensor Plots with Arduino
Learn how to use Arduino/ESP32 with the Aicuflow library to create plots on a connected SPI TFT Display.
Network Bridge Example
When using an Arduino board without wifi access, it seems impossible to stream sensor data to the internet. But our team member Sneha showed it's quite possible. Code below.